Learn with Lin about LC–MS bioanalysis: part III tune the triple quadrupole system

In part I and Part II, we have learned the basic terminology in bioanalysis and the working principles of an LC–MS system. In this third part, we will finally attempt to build up a mass spectrometric method. When I first saw an LC–MS method, I was puzzled by the various abbreviated parameters in the MS settings and couldn’t find a good guide to walk through everything for a beginner. Therefore, while I am on my way learning about bioanalysis, I want to write in detail about this and hope it will serve as a good pamphlet for others to take their first steps climbing the ‘mountain’ of method development.
Lin Wang (Covance, NJ, USA) received her Bachelor of Science degree in Chemistry from Xiamen University in China and Master of Science in Chemical Engineering from Rutgers University in New Jersey, USA. She is also enrolled in the Business and Science Program at Rutgers University to develop a comprehensive understanding of the interface between science and business and look at the revolution of analytical industry from different perspectives.
She started her career with Envigo (NJ, USA) in the department of Formulation and Inhalation Analysis and is currently the Research Associate II at Covance. She has been working in the CRO industry since 2015 and focusing on method development and validation on both small and large molecules.
So, let’s first look at some key parameters in the triple quadrupole MS configuration.
Figure 1: an overview of the key parameters in LC–MS/MS[1]
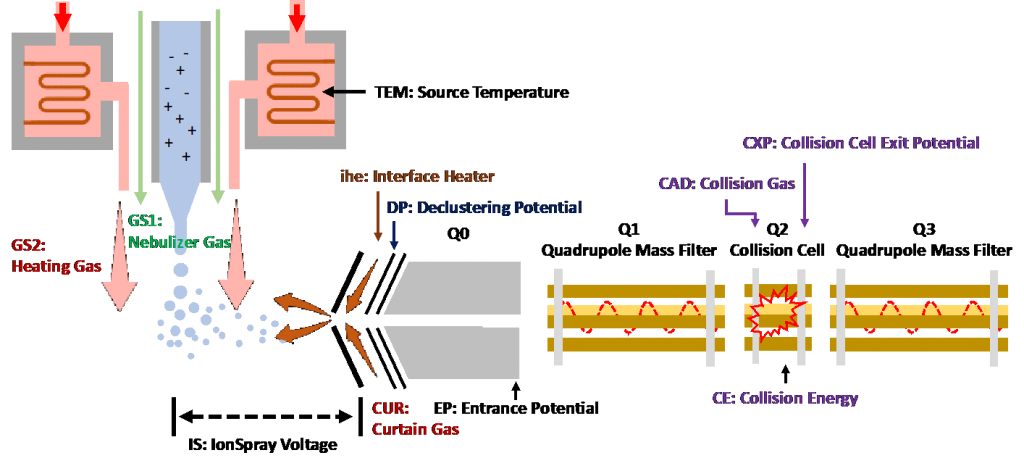
Source-dependent parameters[2]:
- GS1(Nebulizer Gas): This is the gas that assists with droplet formation. It helps to shear the droplets from the stream of liquid coming out of the inlet.
- GS2 (Heating Gas) and TEM (Source Temperature): TEM is the temperature setting associated with the heating of the auxiliary gas. When nitrogen flows through, it gets heated and flows out as GS2, heating gas. The use of TEM and GS2 promotes desolvation and helps the ion evaporation process to ultimately condense the charged analyte, producing gas phase ions.
- IS (IonSpray Voltage): This is the voltage applied between the needle and orifice plate. The created strong electric field eventually pulls the formed ions into the analyzer.
- CUR (Curtain Gas): This is the gas flow between the curtain plate and the orifice. It repulses solvent droplets and neutrals to prevent source contamination and keep Q0 clean. This parameter should be maintained as high as possible without losing sensitivity.
- ihe (Interface Heater): Interface heater helps maximize the ion signal and prevents contamination of the ion optics. It should almost intuitively always be turned on for bioanalytical methods.
Triple quadrupole-mode scan parameters:
- DP (Declustering Potential): DP corresponds to the voltage applied to the orifice to minimize the solvent clusters that may remain on the sample ions after they enter the vacuum chamber. Ions will be accelerated by the declustering potential to acquire enough energy and knock off the remaining solvent molecules. However, higher DP is not always better. Unnecessarily high potential may induce unwanted fragmentation, even linearity of response may be affected by using a non-optimal setting.
- EP (Entrance Potential): This is the potential difference between the voltage of Q0 and ground. It is applied to guide and focus ions to go through the Q0 region. EP has a minor effect on system optimization.
- CE (Collision Energy): This is the potential difference between Q0 and Q2 (collision cell). Precursor ions receive the energy and accelerate into the collision cell, where they collide with gas molecules (CAD gas) and form fragment ions. The higher the collision energy is, the more fragmentation it will induce.
- CAD (Collision Gas): The collision gas aids in fragmenting the precursor ions. When the precursor ions collide with the collision gas, they can dissociate to form product ions.
- CXP (Collision Cell Exit Potential): CXP focuses, accelerates and transmits the ions out of Q2 and into Q3.
These parameters highly depend on the physicochemical properties of a given compound, and optimization is a must, especially DP, CE and CXP. The settings also vary with the nature of the gas supply and the manufacturer of the instrument. In addition, scientists will have their own habits and preferences, which may impact the final settings. The typical values and operational range for each parameter can be found in the system user guide from the manufacturer[3]. For DP, CE, and CXP, they will be further discussed in the later section of the article.
Next, we will get into more details of how to tune the MS system[4].
If you have worked with an HPLC-UV system, for an unknown compound, the first thing you will need to do is to scan through UV and get the optimal wavelength. Then you can set up the detector and work on the chromatography part. Similarly, with LC–MS, the first step is to optimize the detection condition, too. However, for a MS detector, it is more complicated since it has many more variables. Below are some typical steps involved.
Step 1: Introduce sample to MS[5]
Infusion vs FIA
Infusion and flow injection analysis (FIA) are two widely used techniques used for introducing the sample to MS. Infusion is the continuous flow of the sample at lower flow rates into the ion source using a syringe pump. FIA is the injection of a sample by the autosampler into the mass spectrometer using LC. What they have in common is that there is no chromatography. The analyte is made at a certain concentration in the solvent containing a specific composition of organic to aqueous, and with pH control 50:50 composition of the mobile phases and introduced into the MS. The typical concentration range is from 10-500 ng/mL, depending on the sensitivity of the analyte and the instrument. For some advanced models, a syringe pump has been designed into the MS part, which offers great convenience for the scientists.
Table 1: differences between sample introduction methods
| Method | Required devices | Parameters | Typical flow rate range |
| Infusion | Syringe pump | Compound-dependent | 5 to 25 μL/min |
| FIA | LC pump and Autosampler | Source- and compound- dependent | 25 to 1000 μL/min |
Figure 2: an overview of a typical infusion optimization process
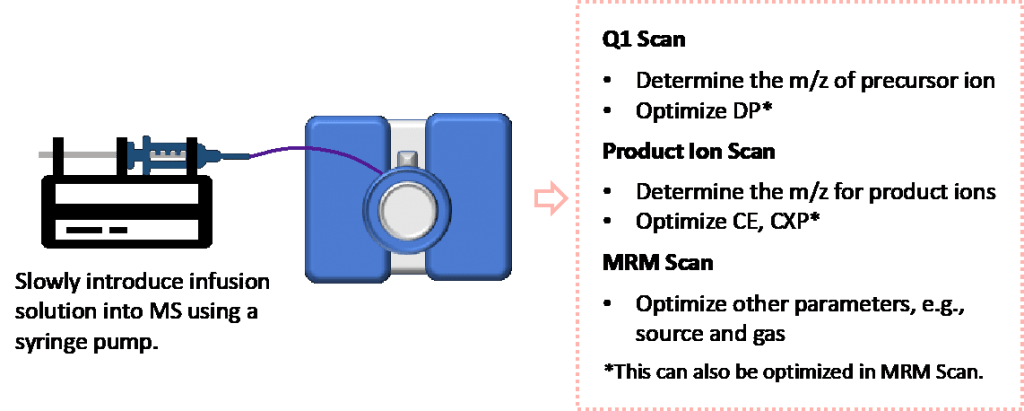
Step 2: Q1 scan or precursor ion scan
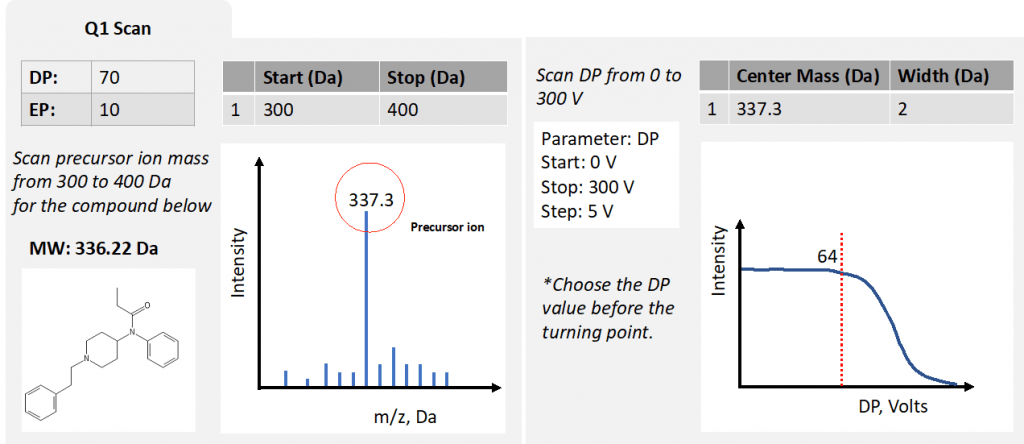
This scan mode will enable you to select the range of m/z and confirm the presence of your desired precursor ion and its m/z. In this scan, we establish the exact m/z of all our precursors and determine optimal DP and EP. For EP, the typical value is 10 V for positive ions, and -10 V for negative ions. For DP it usually ranges from 20 to 100 V. Since only Q1 is involved, there are no CE and CXP at this stage.
In Analyst® Software, if you already know what m/z you are looking for, you can also choose the option to enter the center mass and select a narrow width.
Figure 3: simplified optimization process for Q1 scan
Step 3: product ion scan
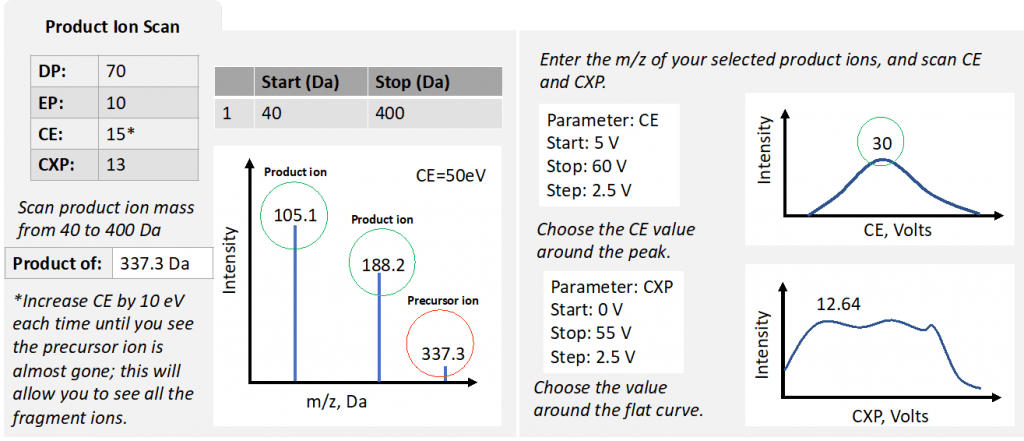
This scan mode will enable you to determine the exact m/z of product ions and again this will feed into the final MRM method. This is where the optimal CE and CXP values are established. Remember to make sure the CAD setting is high enough initially.
Figure 4: simplified optimization process for product ion scan
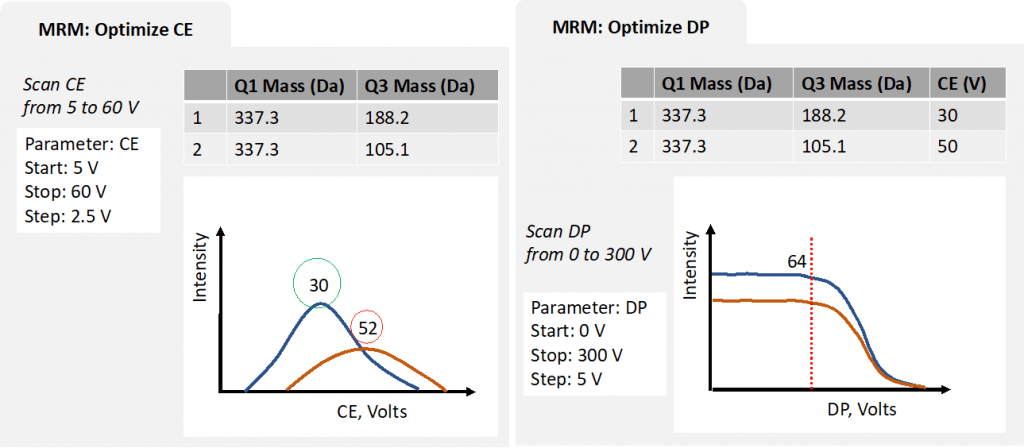
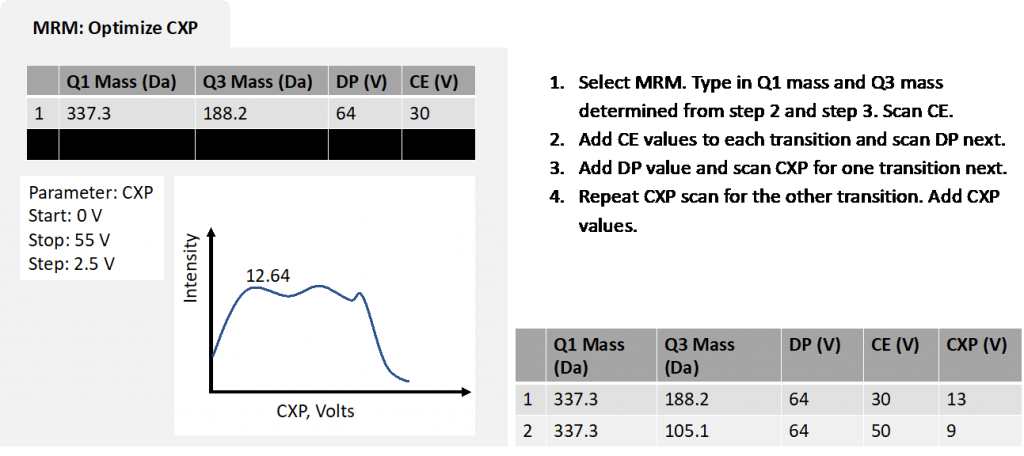
Step 4: use MRM to optimize DP, EP, CXP
Another option for optimizing DP, EP, CXP is to use MRM mode. Instead of looking at each ion, MRM mode can monitor each of the parameters for the selected transitions.
Figure 5: simplified optimization process for MRM Scan
 SRM vs MRM[6]
Probably many people, in the early days of learning LC–MS, will often get to see these two terms in some resources and wonder what they are and what the differences are.
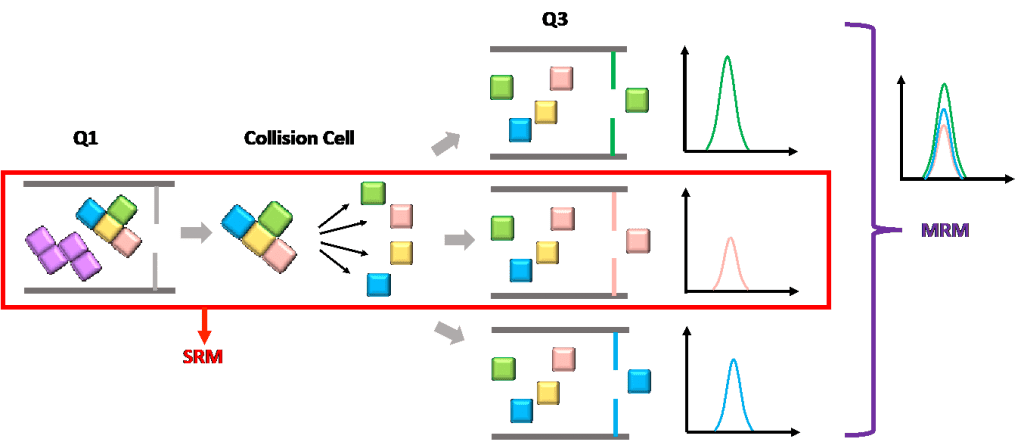
SRM refers to selected reaction monitoring, while MRM is multiple reaction monitoring. The difference between these two terms is not very clear. Sometimes, they are interchangeable. In other places, SRM is defined as monitoring one product ion from one precursor ion, while MRM monitors multiple product ions from one or more precursor ions, in parallel.
Figure 6: compare SRM and MRM
Step 5: optimize gas settings and IonSpray voltage or APCI needle current
MRM is also used to establish optimal curtain gas, collision gas, auxiliary and sheath gases. Also, the voltage applied to the TIS electrode and, if using APCI (Heated Nebulizer) the applied needle current setting.
The optimization process also ties up to the software you are using and the type of instrument. The input for other information, e.g., scan cycles and time duration, may be needed as well. Here we only try to illustrate some basic steps and get a general idea about the process.
Summary
In this article, we have discussed the role of each parameter in the MS settings and the typical procedure for tuning the system using an infusion method. This is the last instalment for the ‘Learn with Lin’ series. However, there are many more areas I have not covered, for example, how to in-depth optimize the ion-source or how to predict fragmentation. In bioanalysis, there is certainly so much more to explore and I hope everyone will enjoy your own journey in this realm!
References
- Why LC/MS/MS? https://www.slideserve.com/florence-montgomery/why-lc-ms-ms.
- Analyst® 1.6.1 Software Getting Started Guide. https://sciex.com/Documents/Downloads/Literature/Analyst-Getting-Started-Guide.pdf.
- 6500 and 6500+ Series of Instruments. https://collateral.sciex.com/manuals/6500-6500plus-system-user-guide-en/6500-6500plus-system-user-guide.pdf?_ga=2.218031958.1186320802.1601489922-752934932.1598145728.
- Mass Spectrometry Tutorial: How to Tune Your Analytes. https://www.youtube.com/watch?v=V553L0IKrWQ&t=909s.
- Analyst® 1.6 Software Automatic Optimization Tutorial. https://sciex.com.cn/Documents/Downloads/Literature/Automatic-Optimization-Tutorial.pdf.
- Targeted proteomics. http://www.inf.fu-berlin.de/lehre/WS14/ProteomicsWS14/LUS/lu6a/345/index.html#:~:text=SRM%20vs.,one%20or%20more%20precursor%20ions.
The opinions expressed in this feature are those of the author and do not necessarily reflect the views of Bioanalysis Zone or Future Science Group.
Our expert opinion collection provides you with in-depth articles written by authors from across the field of bioanalysis. Our expert opinions are perfect for those wanting a comprehensive, written review of a topic or looking for perspective pieces from our regular contributors.
See an article that catches your eye? Read any of our Expert Opinions for free.